Carlucci Indicator
The Carlucci Indicator: Friday, October 27, 2017
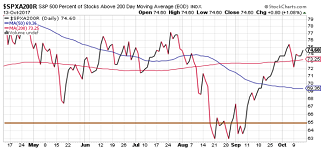
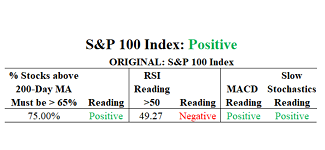
eResearch is pleased to provide The Carlucci Indicator, which has been billed as the Best Stock Market Indicator Ever. [more]
eResearch is pleased to provide The Carlucci Indicator, which has been billed as the Best Stock Market Indicator Ever. [more]
eResearch is pleased to present the Put-Call Ratio courtesy of StockCharts.com. [more]

eResearch is pleased to provide the Fear & Greed Index, courtesy of CNN Money. Investors are driven by two emotions: fear and greed. Too much fear can sink stocks well below where they should be. When investors get greedy, they can bid up stock prices way too far.
Find out what emotion is driving the market now. [more]

eResearch is pleased to present its weekly Channel-Breakers Portfolio, based on the weekly charts provided by TheUpTrend.com. [more]
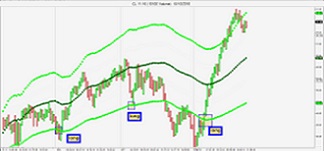
eResearch Corporation is pleased to provide our Channel Breakers Weekly report, which features all of the Canadian stocks that broke above or broke below their respective price-channels, using weekly closing prices. We stress that these charts are based on weekly closing prices and, therefore, are appropriate for use by intermediate-term investors. Our report is prepared courtesy of the technical charts of TheUpTrend.com. [more]

eResearch is pleased to present its Model Oil Portfolio, comprising quality Canadian oil stocks. [more]
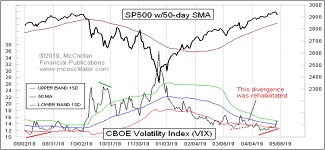
eResearch is pleased to provide the latest reading of the McClellan Oscillator. [more]

eResearch is pleased to provide an article written by noted columnist, Mark Hulburt. The title of the article is How Do You Know When It Is Time To Buy Gold?. [more]

eResearch is pleased to provide its Clarion newsletter with the topic being Wealth Creation [more]
eResearch is pleased to provide The Carlucci Indicator, which has been billed as the Best Stock Market Indicator Ever. [more]
Copyright © 2024 | MH Magazine WordPress Theme by MH Themes